The ‘road toll’ is a misleading term, which implies that it is a necessary thing to have to pay to have cars. Instead, we think this should be reported as road deaths. Many road crashes can be very serious, hurt people, and change lives forever.
The NSW government has recently released a new plan called Connecting New South Wales with one of the main aims to make NSW roads much safer.
They explain it like this:
“Our 2026 Road Safety Action Plan targets a 50 per cent reduction in fatalities and a 30 per cent reduction in serious injuries on our roads by 2030, setting NSW on a path towards zero road trauma by 2050. In 2024, 340 people were killed on our roads, highlighting the urgent need to address trauma on our roads”
That means:
- NSW wants way fewer people to die on the roads.
- NSW wants way fewer people to get badly hurt on the roads.
- NSW wants to work towards a future where nobody dies on its roads.
But to fix a problem, you first have to understand it. That is where NSW Crash Map comes in.
What is NSW Crash Map?
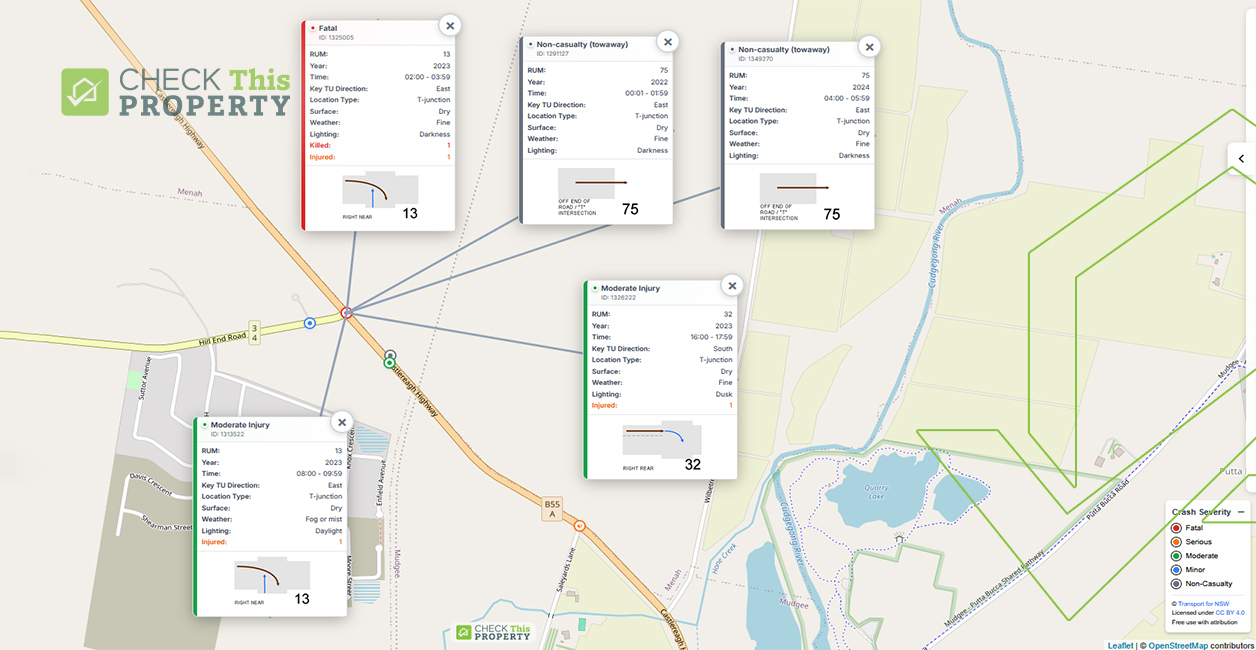
NSW Crash Map is a map that shows where recorded crashes happened in NSW. It uses crash data from the NSW government from the last available five years and displays all crashes visually on a map which can make it much easier to understand than looking at boring tables.
Each crash or location where there are crashes is represented by a dot on the map and if you select an area, all crashes in that area popup with information about each crash. The data reported for each crash includes the Crash ID, Road User Movement (RUM) code, the year of the crash, time the crash occurred, whether the surface was wet or dry and the natural lighting.
Why this matters (especially in regional NSW)
Regional NSW has around 1/3 of the population of the state, but about 2/3 of the road deaths occur on regional roads.
This means that people in regional areas are being hurt and killed on the roads at a higher rate, compared to how many people live there.
So if we want safer roads in NSW we cannot just focus on cities and must also pay close attention to regional towns and highways.
The Connecting New South Wales strategy also says:
“technology and data will be critical to implementing this strategy and delivering a safe, reliable, integrated and equitable transport network for NSW.”
In simple terms, that means:
- Using good information (data) helps people make better choices.
- Using useful tools (technology) helps people understand problems more quickly.
- If we want safer roads, we need to look at the facts and use them as part of a broad and strong response to the safety issue.
Why we built NSW Crash Map
We built NSW Crash Map for one main reason:
To give everyone an easy way to see crash data clearly.
When people can see what is happening:
- Communities can ask better questions.
- Local leaders can make better decisions.
- Everyone can understand what is going on, instead of the data being hidden or difficult to find and understand.
Zero deaths is a long way off at the moment for New South Wales but there is one city in Europe that has achieved this. Helsinki went 12 months without a road traffic death from July 2024 to August 2025. Good data available to the public is only one step in achieving zero road deaths and we will be watching to see how things progress.
Take a look at NSW Crash Map
If you care about road safety, or you just want to understand what is happening where you live, NSW Crash Map makes it simple to explore.
Because safer roads start with seeing the problem clearly.